


From Loops to Graphs: The Architecture That Beats a Bigger Model
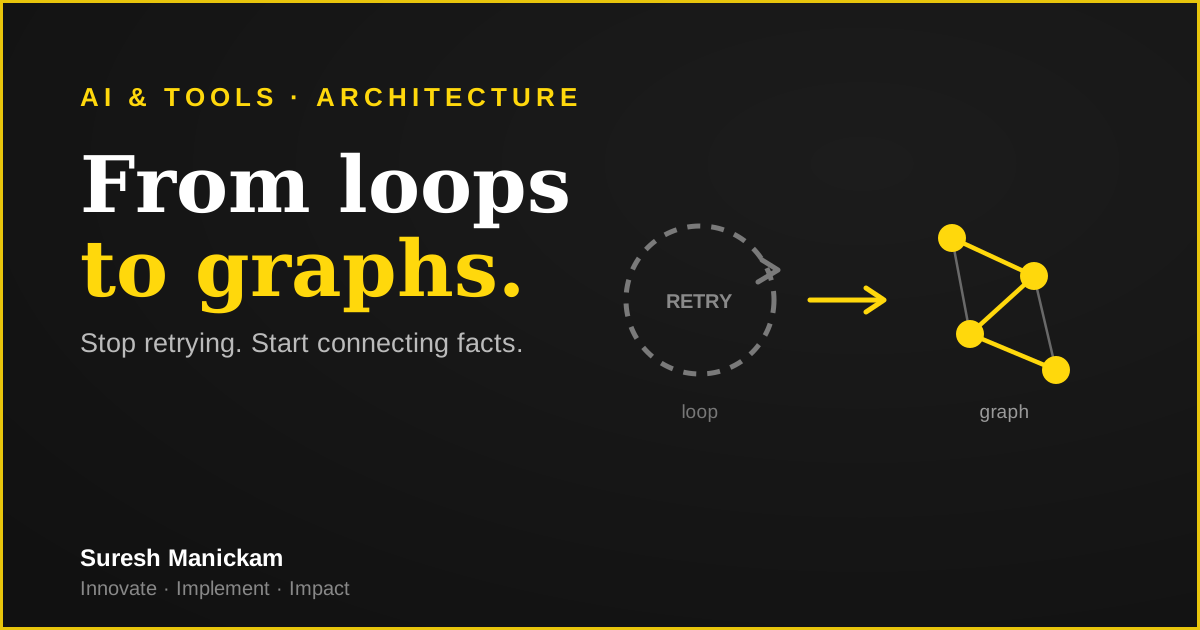
Most AI systems I see still break the moment a question gets complicated. You ask, the system pulls back some similar-looking text, the model writes an answer, you check it, you tweak the prompt, and you go around again. That’s loop engineering, and it has a ceiling.
There is a better shape for hard questions. It is not new and it is not a secret, because Microsoft has published the research behind it. Most teams just haven’t moved yet.
Where the loop runs out
Standard retrieval works like this. Someone asks a question, the system finds text chunks that look similar, and the model writes an answer from those chunks. That’s fine for most things. It isn’t fine for the questions that actually matter.
Ask why sales dropped in March. A vector search goes off and finds documents with "sales" and "March" in them, then hands you fragments. It can’t hand you a chain of causes, because those causes are sitting in five different documents that share no keywords with each other.
What you needed was the chain:
Warehouse failure → supplier delay → release delay
                  → negative reviews → conversion down 23%
No amount of better embedding gets you there. Similarity finds documents that look alike. It doesn’t find facts that connect. So you loop. Retry, re-prompt, add context, chunk it differently, try again. The loop is you doing by hand what the architecture refuses to do for you.
What graph engineering actually is
Rather than storing text and searching by similarity, you store facts and the relationships between them, then query the relationships directly.
Everything becomes a triple. Subject, relation, object.
Kimi K3    → developed by     → Moonshot AI
Kimi K3    → context window   → 1M tokens
Kimi K3    → built on         → Kimi Delta Attention

Warehouse  → caused           → Supplier delay
Supplier   → caused           → Release delay
Release    → reduced          → Conversion rate
A vector database stores "this paragraph is about supply chains." A knowledge graph stores "this specific event caused that specific outcome." That difference is structural, not cosmetic.
When you query it, you’re no longer asking which text looks like your question. You’re asking the system to walk the path from A to B and show you every link along the way.
Two kinds of question
Microsoft's GraphRAG research has the clearest framing I’ve found, and it splits queries in two.
Local search answers "what happened with supplier X in July." It finds a node and fans out to its immediate connections. Global search answers "what are the recurring risk patterns across all our suppliers." It works across the whole graph, using community summaries rather than single documents.
Standard retrieval handles the first one badly and the second one not at all. A graph handles both.
Why Kimi K3 is a good fit
Model choice matters here for architectural reasons rather than marketing ones. Building a graph means reading a lot of source material in one pass and holding it together long enough to pull out the entities and the relationships between them. Miss the context and you get orphaned facts, which is how graphs quietly go wrong.
Kimi K3 ships with a 1M token context window. It’s a 2.8 trillion parameter open mixture-of-experts model from Moonshot AI, built on Kimi Delta Attention, a hybrid linear attention design the team says decodes up to 6.3 times faster at million-token contexts. Long context plus cheap decoding is exactly the combination graph extraction eats.
It also happens to be sitting at the top of Code Arena's fullstack board right now.
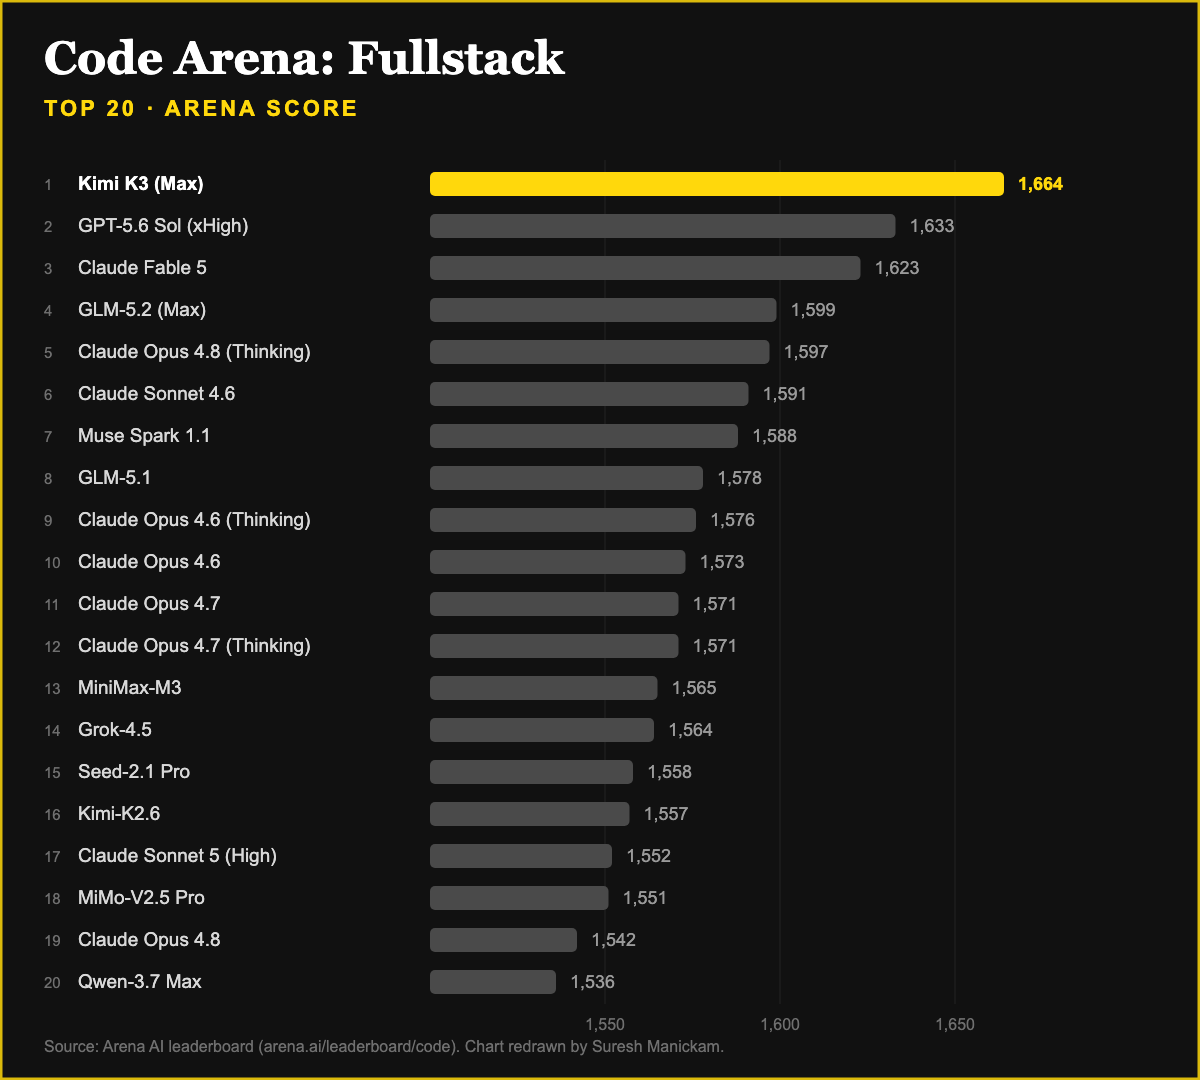
Keep some perspective on that chart though. The top four sit inside about 65 points of each other, which is close, and leaderboards move every month. They also measure someone else's tasks, not yours. Use it to shortlist, then test on your own data.
What I would actually do
If someone is pitching you a retrieval project, the useful question isn’t which model to buy. It’s what shape the questions are. If your people ask "find me the document about X", similarity search is fine, and it’s cheaper. If they ask "why did this happen", you need something that stores connections, because that answer doesn’t live in any single chunk.
Start small enough to be honest about the result. Take one question your current system answers badly, map the twenty or thirty facts behind it as triples by hand, then check whether that path was ever recoverable from your chunks. It takes an afternoon and tells you more than any vendor demo will.
The caveat deserves equal airtime. Graphs cost more to build and more to keep alive. Something has to extract those entities, the extraction gets things wrong, and a stale graph is worse than no graph because it’s confidently wrong. Budget for the maintenance before you fall in love with the architecture.
Loops aren’t going away. They are just the wrong tool for questions with causes in them.